
The endurance limit obtained from laboratory testing does not represent real engineering conditions.
Standard S-N data are generated using:
- Polished specimens
- Small diameters
- Controlled laboratory environments
- Fully reversed loading
In practice, real components differ significantly from these ideal conditions. Therefore, the laboratory endurance limit S′e must be corrected before being used in design calculations.
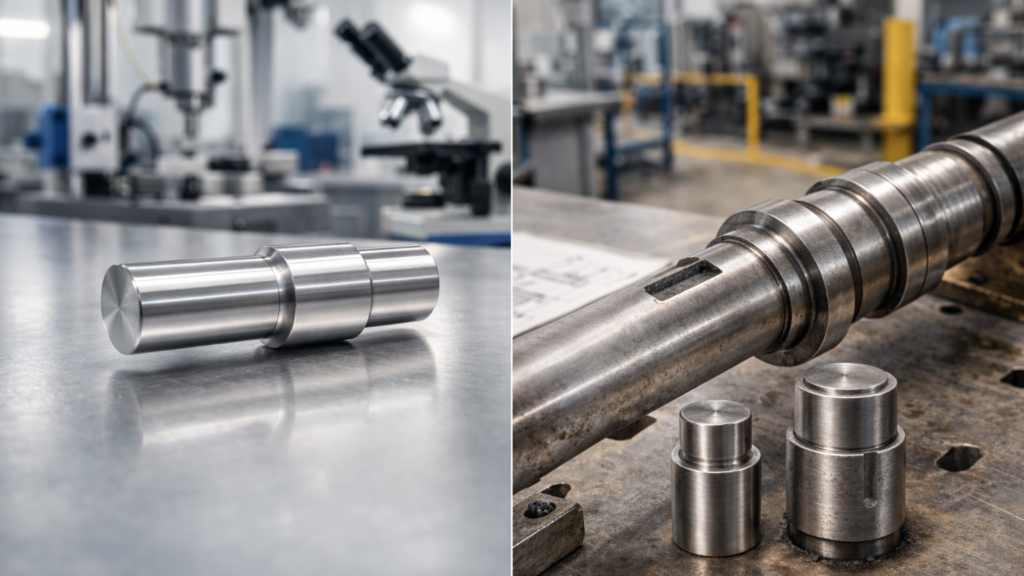
From Laboratory to Real Component
The corrected endurance limit is defined as:
Se = ka kb kc kd ke S′e
Where:
- S′e – laboratory endurance limit
- ka – surface condition factor
- kb – size factor
- kc – load factor
- kd – temperature factor
- ke – reliability factor
Each coefficient accounts for a physical effect that reduces fatigue strength in real components.
1. Surface Condition Factor ka
Fatigue cracks initiate at the surface. Surface roughness increases local stress concentrations at a microscopic scale.
Typical trend:
- Polished surface → higher fatigue strength
- Machined surface → reduced fatigue strength
- Forged or cast surface → further reduction
The surface factor is commonly expressed as:
ka = a Sutb
Where coefficients depend on the surface finish category.
Surface treatment is often one of the most effective ways to improve fatigue resistance.
2. Size Factor kb
Larger components exhibit lower fatigue strength.
This is primarily due to:
- Higher probability of defects
- Larger stressed volume
- Increased stress gradients
For rotating shafts in bending, empirical relations are commonly used to estimate kb. The size effect becomes increasingly important for diameters above approximately 8-10 mm. Ignoring this factor may lead to unconservative designs in large shafts.
3. Load Factor kc
Fatigue strength depends on loading type:
- Bending
- Axial
- Torsion
For example, endurance limits under torsion are typically lower than in bending. The load factor adjusts the endurance limit accordingly.
4. Temperature Factor kd
Elevated temperature reduces material strength and fatigue resistance.
For steels operating below approximately 200°C, the temperature effect may be small. At higher temperatures, fatigue strength decreases and correction becomes essential.
5. Reliability Factor ke
Fatigue data represent statistical scatter. Designing for higher reliability requires reducing the allowable endurance limit.
Typical values:
- 95% reliability → ke ≈ 0.868
- 99% reliability → ke ≈ 0.814
- 99.9% reliability → ke ≈ 0.753
This adjustment ensures that only a small percentage of components are expected to fail prematurely.
Reliability selection is therefore not merely a mathematical correction, but a design decision.
Engineering Implications
The modified endurance limit is almost always lower than the laboratory value.
In real shaft design:
- Surface finish
- Diameter
- Required reliability
often reduce the endurance limit significantly.
Neglecting these corrections may result in overestimated fatigue life and underestimated shaft diameter.
Conclusion
The laboratory endurance limit S′e is only a starting point.
Real engineering components require systematic correction to account for surface condition, size, loading type, temperature and reliability.
The modified endurance limit provides a more realistic basis for fatigue design and represents a necessary step before applying the Stress-Life method to practical shaft calculations.